


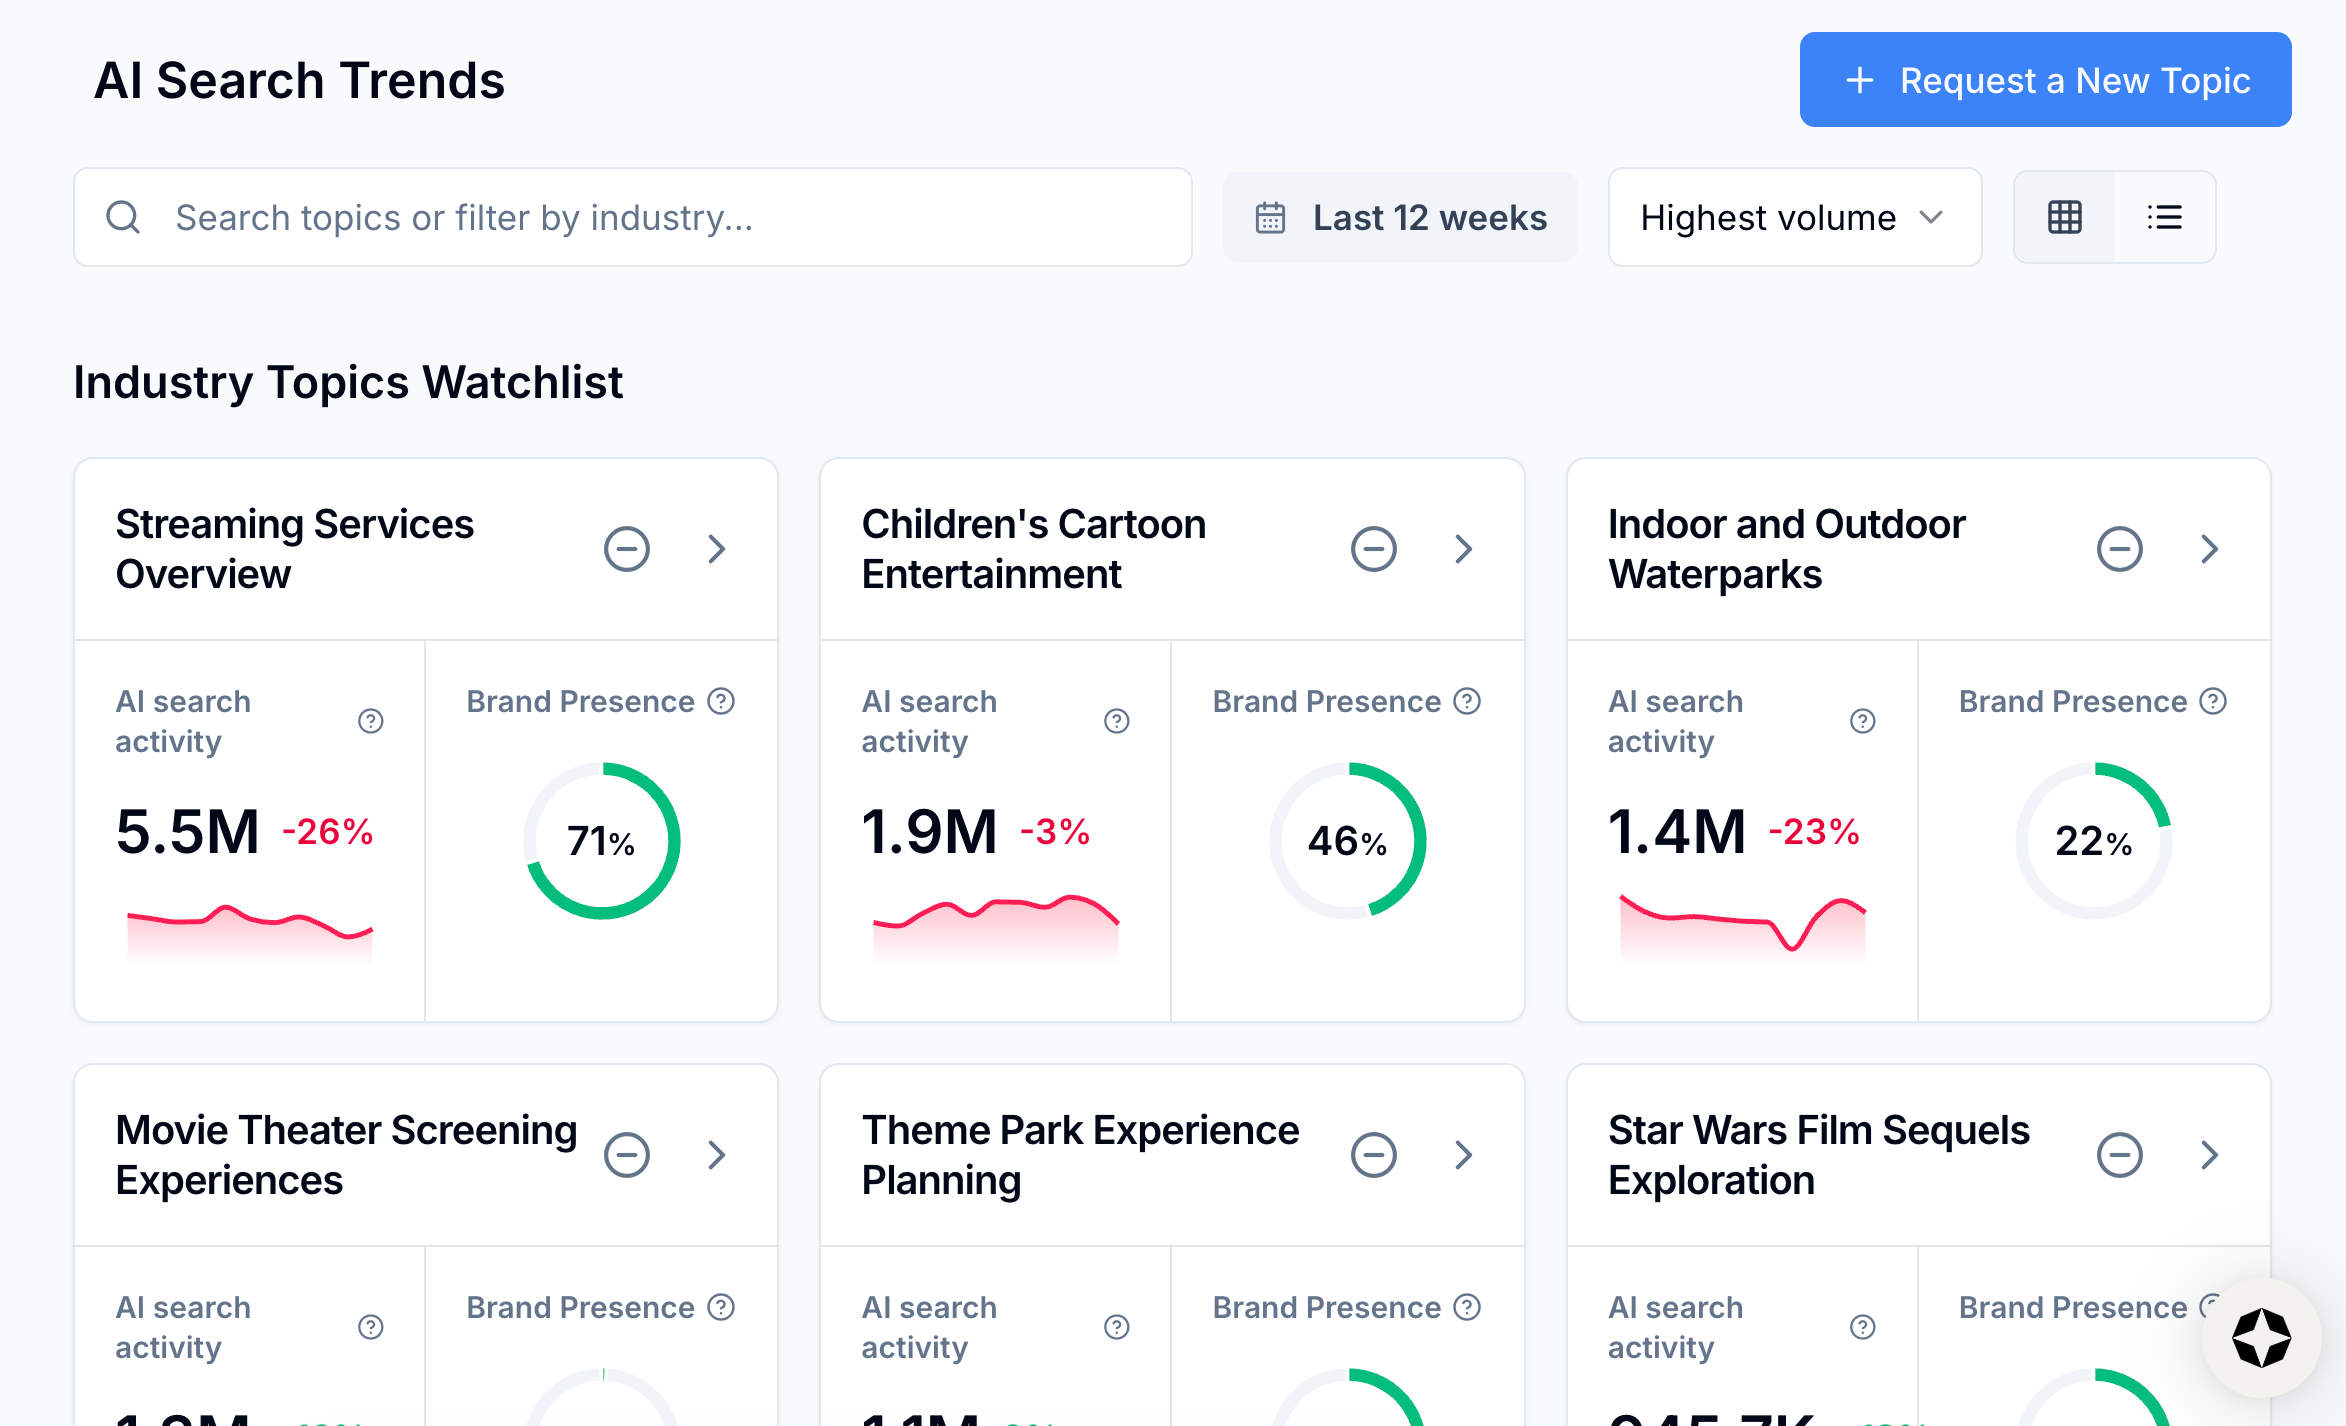
When we launched AI Search Trends, it marked the first time that we brought panel data into the Scrunch platform.
The natural follow-up question: “What the heck is panel data?”
There’s a good chance you’ve used it, even if you don’t recognize the name. Many SEO tools combine panel data with other data sources to estimate keyword volume.
As Scrunch's resident data scientist, I wanted to dig into the nuances and demystify panel data for our customers (without requiring a statistics degree).
Whether you're deep in the data weeds or just want a high-level understanding of what's powering your AI Search Trends dashboard in Scrunch, you should find what you’re looking for below.
What is panel data?
You can’t define “panel data” without first defining “panel.”
A panel is a consistent set of opted-in users and/or devices observed over time. It’s designed to measure behavior and change, as opposed to perfectly counting the entire universe.
Our panel data comes from multiple opt-in collection sources and integrations and is then anonymized. At a high level, it can include prompts and queries, domains visited, and device context (depending on the source).
Why is panel data valuable?
Panels are not the best tool for claiming an absolute number, but they are a good tool for measuring directional movement and relative comparisons.
And for most of our customers’ marketing use cases, that’s the real signal: how consumer interest is shifting over time (aka what are potential customers asking AI about?).
You can’t depend on panel data to give you a single count that perfectly matches a platform report from something like Google Search Console (GSC). But, if it’s properly handled, you can count on it for reliable directional insights.
Put another way: Panel data is powerful, but easy to misuse. Especially when compared to census sources.
Panel sources vs. census sources
Panels are a consistent sample of users across platforms, domains, and devices, which makes cross-surface comparisons possible.
Census sources tell you what you can observe within a single platform or property (see: GSC). These sources are complete within that system’s reporting rules, but they don’t provide complete visibility into user behavior.
Neither is “better” by default. They just answer different questions.
In our case, panel sources provide things that census sources often don’t, including:
- Cross-engine and cross-domain visibility (not tied to one property or one platform)
- Cross-device context (because behavior can look different on mobile versus desktop)
- Coverage in places we don’t control (e.g., competitor research, third-party websites, assistants, etc.)
- More actionable segmentation when platform reporting is bucketed, thresholded, and/or redacted
Panel data pitfalls
So what makes panel data easy to misuse? You can bucket it out into three main challenges:
- Bias and composition
- Units and exposure
- Taxonomy and mapping rules
1. Bias and composition
This includes:
- Selection bias/convenience sampling: Panel users are self-selected (people have to opt in, remember?) and won’t match the full population by default.
- Behavioral changes: Lots of things can affect behavior and who participates in a panel: incentives, tooling, measurement setup, etc.
- Drift and composition effects: The panel mix changes over time (users opt out, new users opt in, device mix shifts, etc.). If you ignore this, you may end up measuring “who’s in the panel” versus “what’s actually happening.”
Here’s an example based on that last bullet:
Say you start with a panel that’s made up of 80% men and 20% women. A month later the panel make-up shifts to 50% men and 50% women. You notice a month-over-month jump in AI searches related to “natural cosmetics.”
That might be a real increase. Or, women may be more inclined to express intent in natural cosmetics. In that case, you’re recording an overall rate rise even if nothing has really changed within each group (aka creating a fake trend).
We work to reduce composition-driven swings by reweighting the panel to match known population totals (e.g., gender, age, region, device, etc.).
If a group is over-represented in the panel, it gets less weight. If it’s under-represented, it gets more. Done consistently over time, this makes trend and share estimates more representative and more comparable.
You can dig more into how we ensure the reliability of our panel data in this blog post.
2. Units and exposure
Panel participants can interact with AI search in multiple ways. They can search in Google and receive an AI Overview alongside traditional results. Or they can prompt platforms like ChatGPT or Gemini.
To estimate demand for a topic, we need to identify all interactions with AI surfaces, assign them to a topic, and add them up in a meaningful way (e.g., combining ChatGPT conversations with Google AI Overview searches).
The real unit of demand isn’t a “prompt” or “query,” it’s a task.
In both GenAI and web search, demand comes in steps. The first input is usually a starting point, then people add constraints until they land on their answer.
In chat-first experiences, one intent often unfolds across multiple turns because the system retains context and users refine as they go. But this isn’t totally unique to chat.
Traditional search often involves query rephrasing and multi-query sessions for a single task—it’s just less obvious when you look at keyword reports.
The upshot: There’s no stable exchange rate between GenAI prompts and Google searches.
How many “events” you see for the same intent depends a lot on product design and user habits. Some users get AI embedded inside search via AI Overviews. Others switch into chat when they want AI, which naturally changes prompt counts.
Follow-ups are also manufactured by interface design, so “turn counts” inflate differently across products. Google’s AI Mode explicitly encourages going deeper via follow-up questions, and chat UIs naturally invite iterative refinement, which can raise prompt volume even if underlying intent volume is flat.
We use demand regularization techniques to stabilize absolute demand for topics, preventing any one conversation from artificially boosting large parts of the taxonomy.
3. Taxonomy and mapping rules
Keyword volume measurement is mostly literal. If “striped shirt” appears in the query, it counts. If it doesn’t, no dice.
But prompts work differently.
A real prompt might be something along the lines of, “Find me the best shirts without stripes for a job interview under $60 that can be delivered in less than a week.” The language is longer, more varied, and more long-tailed. Important information is spread across context, constraints, and phrasing, not a single repeatable string.
When people express the same intent in dozens of ways (e.g., “without stripes,” “solid,” “plain,” “not patterned,” etc.), individual prompt strings are too sparse to track reliably.
That’s why we launched AI Search Trends based on topics, not keywords. Topics are how we turn messy language into something we can measure consistently.
But topics are not a law of nature. They’re the map, not the territory, and taxonomy plus mapping rules partially define what you’re measuring.
So if you change topic definitions, thresholds, or the assignment method, your absolute levels can move even if real behavior did not, which is why taxonomy changes should be treated like a measurement update that requires re-baselining.
We measure intent using a stable topic framework (i.e., consistent granularity and rules). When that framework changes, we treat it as a measurement update and re-baseline so methodology shifts don’t look like market spikes.
Panel data dos and don’ts
Panel data best practices apply to people outside the data team.
Here are some dos and don’ts to keep in mind when you’re analyzing panel data for decision-making:
Do:
- Treat panel trends like an attention index. Focus on direction, share shifts, and differences by segment when available.
- Check whether a result holds over a longer window and at a slightly broader topic definition before acting on it (spikes are easy to misread).
- Use your first-party data sources as a reference point, then use the panel to understand what is happening outside of your property and across surfaces.
- Question whether measurement changed before trusting a spike—topic taxonomy/mapping tweaks or coverage changes can move the chart even when real behavior is flat.
Don’t:
- Treat panel counts as exact “market totals.” Panels are best for movement and comparisons, not perfect absolutes.
- Expect to reconcile panel data one-to-one with platform reports like GSC. GSC suppresses (“anonymizes”) some queries for privacy and can behave differently when filters are applied.
- Compare queries versus prompts as if they’re the same currency. AI conversations often unfold across multiple turns, and that is a different interaction pattern than single-query reporting.
- Over-interpret tiny slices (narrow topic × narrow cohort × short window). That’s where scarcity and churn dominate.
Used right, panel data turns noise into signal. Used wrong, it turns dashboards into fiction.
The difference is in how you (or how your data provider) manages sampling, units, and measurement choices.
And as you may have guessed from reading this post, we take it seriously.
Track AI search trends with Scrunch
See what your target audience is asking AI and how you show up. Start a 7-day free trial or get in touch to see how you can track AI search volume.


