


AI search doesn’t just mean ChatGPT. It doesn’t just mean AI platforms either.
There are two primary ways that AI is augmenting search:
1. Conversational agents: Think ChatGPT, Claude, Perplexity, Gemini, Grok, etc.
2. Generative overlays: Think Google AI Overviews.
Each option presents a path to consumers.
They can discover, learn about, and ultimately select your brand via a back-and-forth chat session with an LLM or an AI-generated summary layered on top of a traditional search result.
Which path are people picking? The answer isn’t singular.
We took a subset of our data and analyzed 100K unique users across 7.6M AI search sessions (including 11M prompts and 11M responses) over three months. You can dig into our findings below.
The main takeaway? If you want to build a sound AI search strategy, you need to think multi-channel.
______
A quick note on our data:
Using our AI Search Trends feature, we analyzed AI search behavior related to six industry supercategories (finance, healthcare, ecommerce, automotive, education, and software).
To try to make our analysis apples-to-apples, we focused exclusively on dual-mode users within each category (i.e., people who used both modes of AI search in a specific category).
We calculated the share of prompts by mode for each person and then averaged those shares at the category and topic levels. Percentages are rounded to the nearest integer.
______
AI Overviews are winning (but not by much)
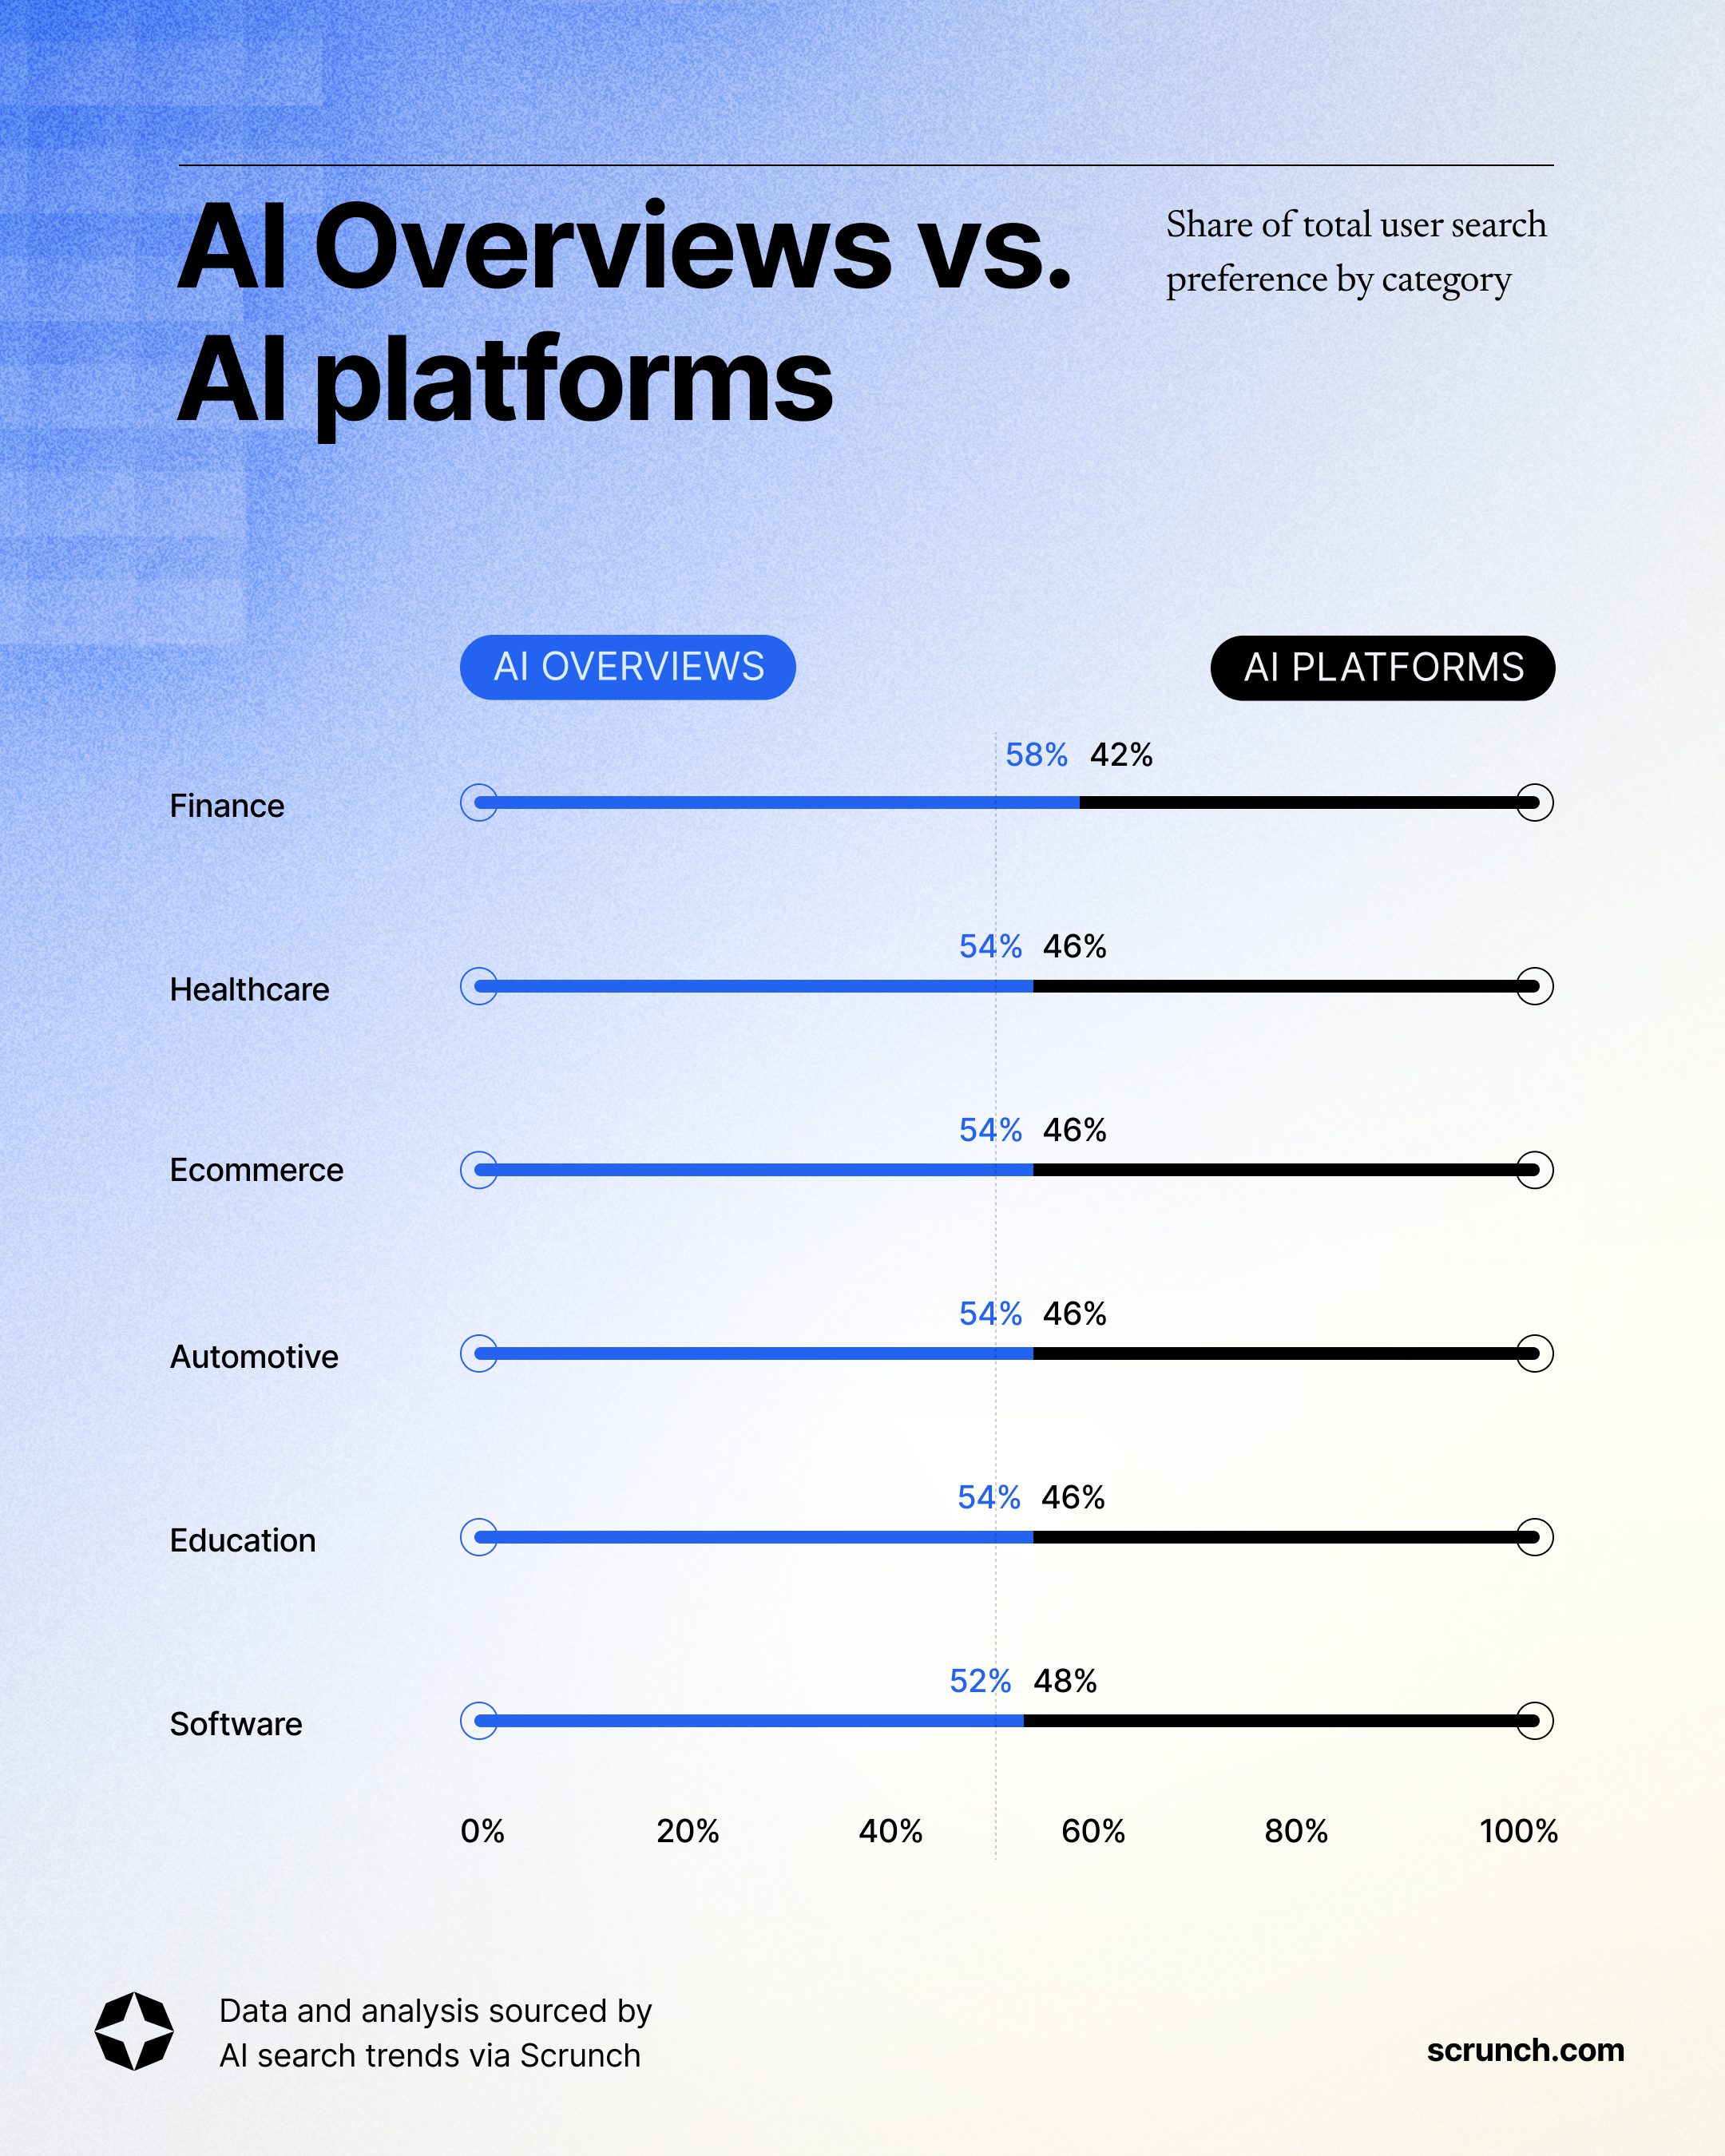
Across industry categories, generative overlays (i.e., Google AI Overviews) were slightly favored among dual-mode AI users.
The preference shows most clearly in the finance category (58% versus 42% preference for AI Overviews). Meanwhile, the software category was the closest to parity (52% versus 48% preference for AI Overviews).
Topics under each category generally followed the category-wide trend, but there were notable divergences.
Topics more aligned with shopping and comparison tended to lean more heavily toward generative overlays while topics more aligned with exploratory research, tools, and workflows tended to give more ground to conversational agents.
It's not terribly surprising that Google still has an edge. As the most popular traditional search engine, it has a global daily user base of 2B+ users. Its AI Overviews are triggered automatically for certain search queries, which reinforces using Google for similar queries.
It’s safe to say that Google isn’t going away anytime soon, but more and more consumers are discovering brands in AI platforms and converting without ever seeing a blue link.
Something else to keep in mind: Usage of one AI search channel doesn’t preclude usage of another. Users can jump between AI search modes within a single search session, potentially discovering brands in one channel and deepening their knowledge in a different one.
In other words, it's not a question of optimizing for ChatGPT or AI Overviews. Your customers choose both.
Topic-level breakdown: Where AI Overviews dominate (and where they don't)
We identified the top 12 topics within each category based on search volume.
Then we curated that list to find topics with the highest absolute difference between shares of generative overlay and conversational agent interactions.
We found that while categories as a whole may skew one way, there are topics within each that lean more toward conversational agents—and sometimes overtake generative overlays completely.
Here are our findings (topic preference for generative overlays versus conversational agents):
Finance
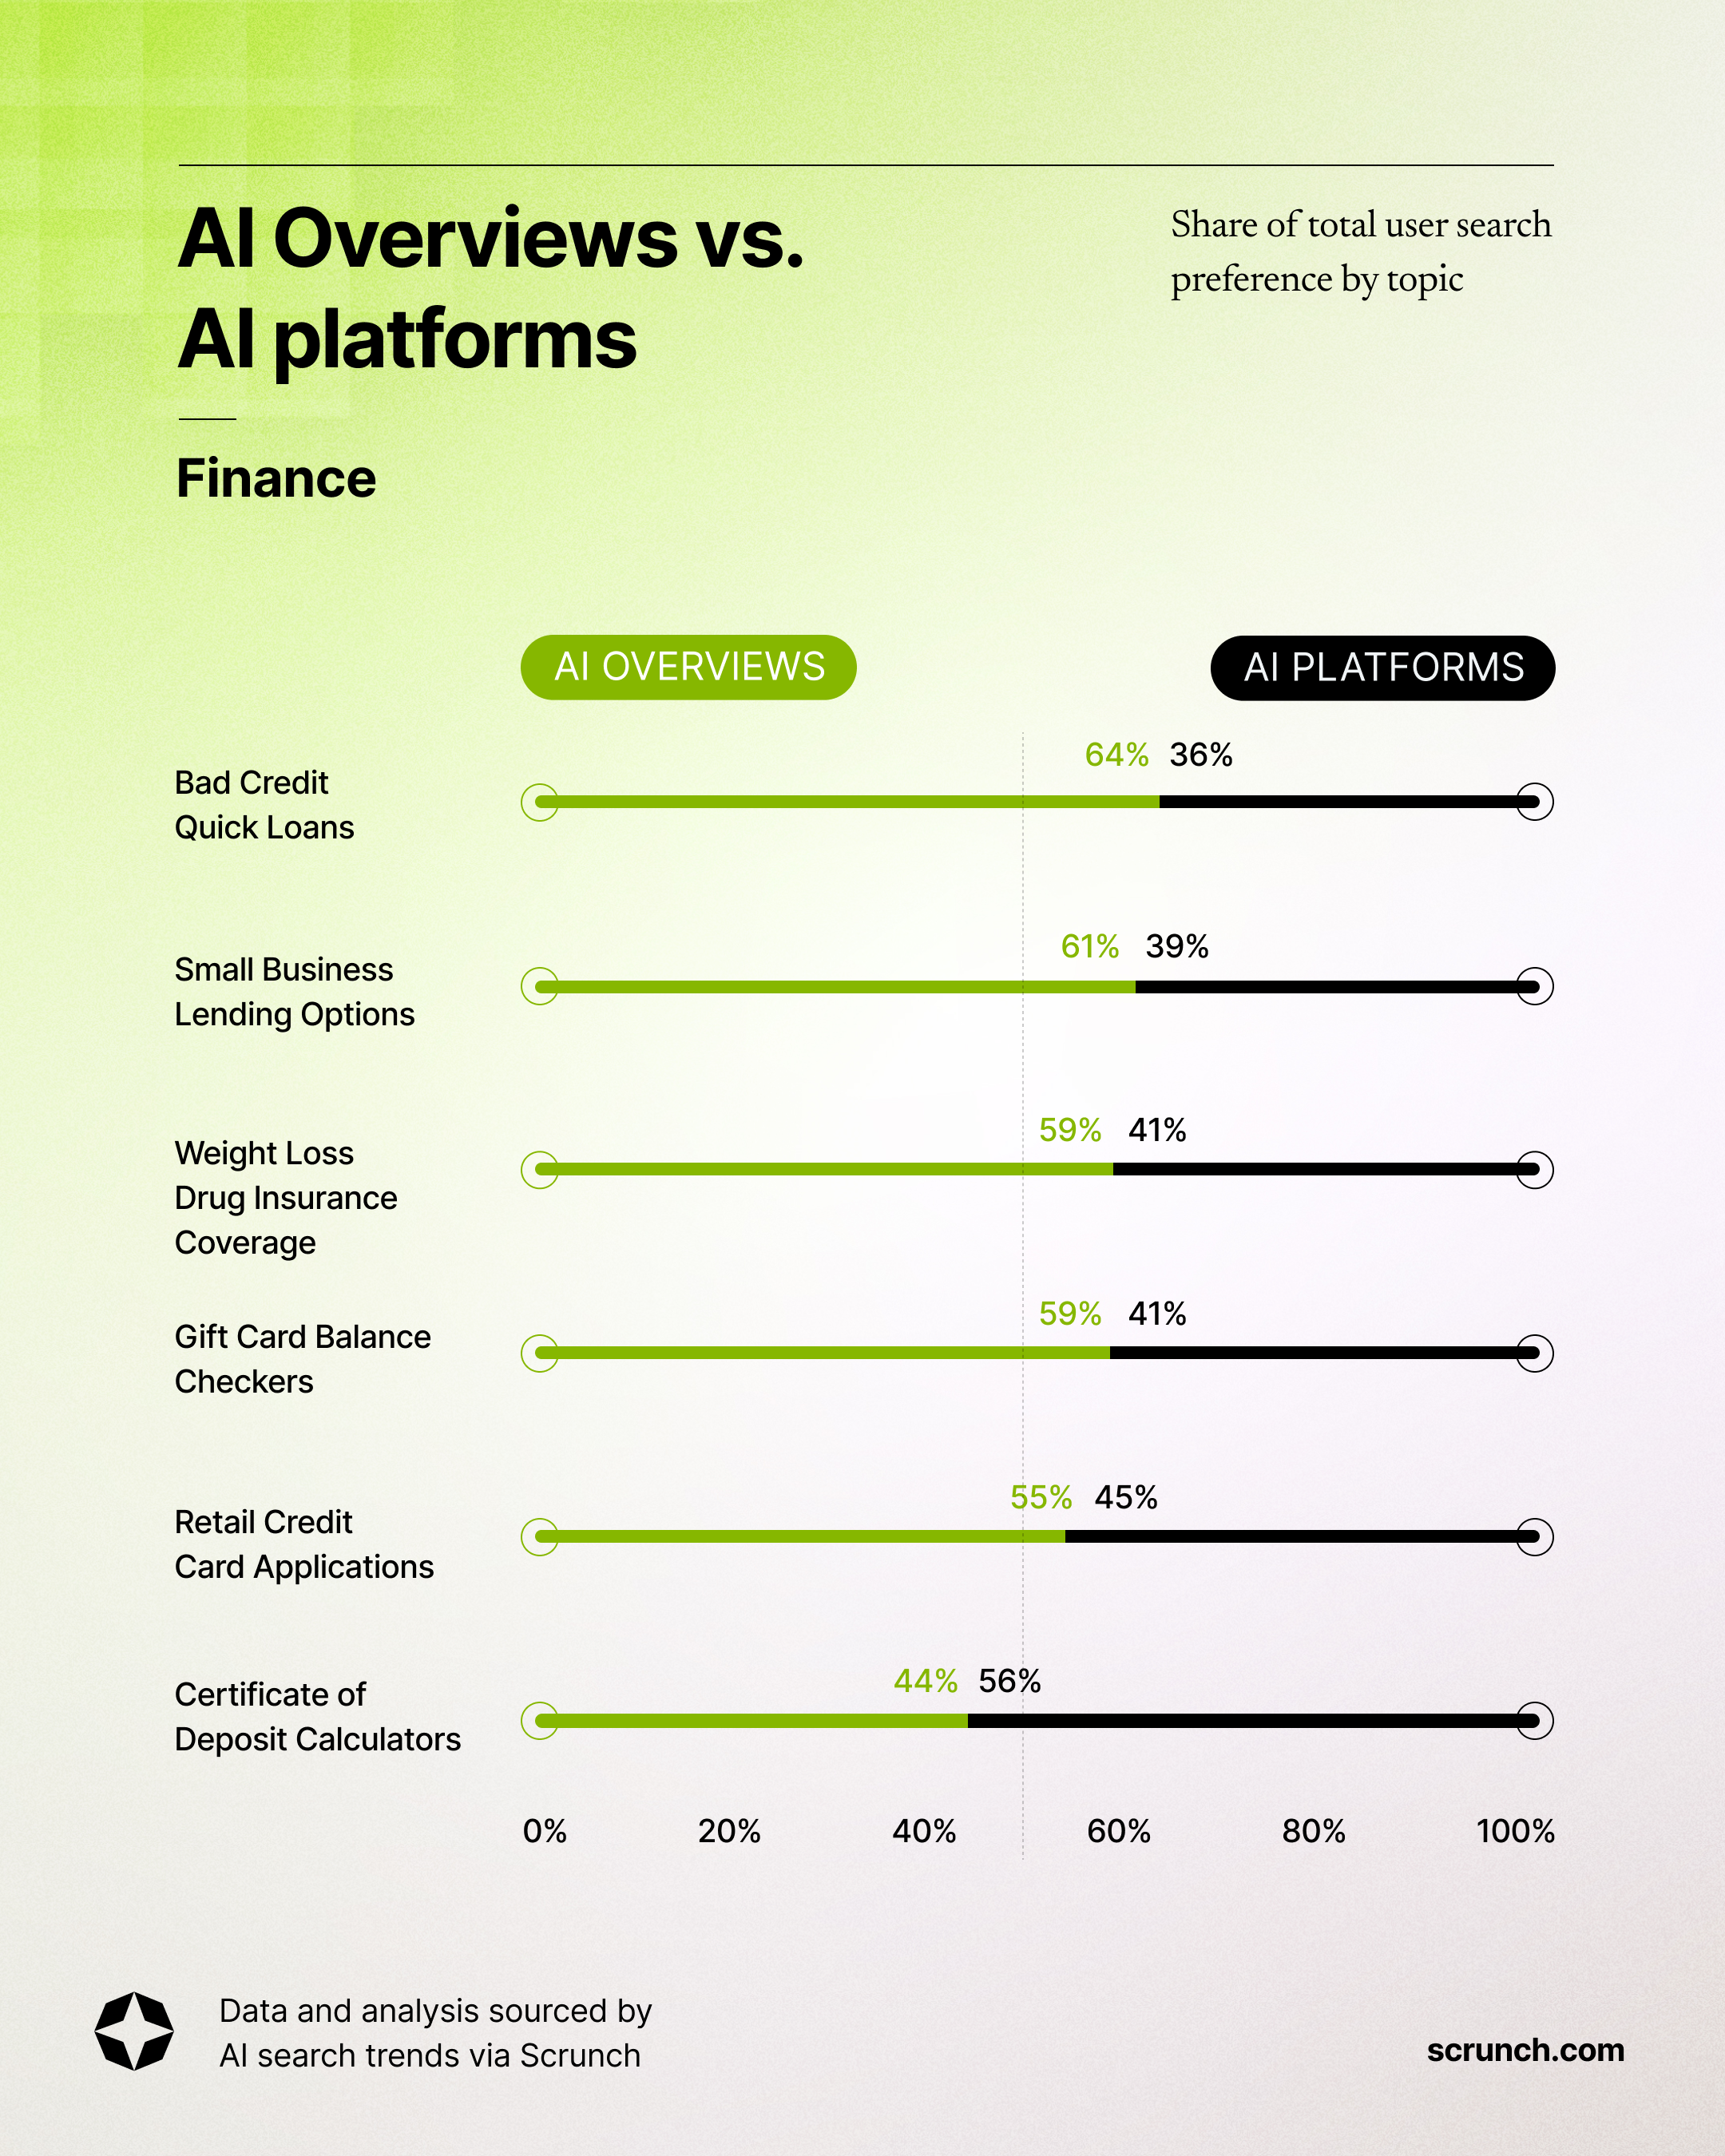
1. Bad Credit Quick Loans (64% versus 36%)
2. Small Business Lending Options (61% versus 39%)
3. Medical Coding and Billing Codes (60% versus 40%)
4. Immigrant Credit Solutions (60% versus 40%)
5. Gift Card Solutions (59% versus 41%)
6. Weight Loss Drug Insurance Coverage (59% versus 41%)
7. Gift Card Balance Checkers (59% versus 41%)
8. Bank Routing Number Lookup (58% versus 42%)
9. Commercial Truck Financing (57% versus 43%)
10. RV and Camper Insurance Solutions (55% versus 45%)
11. Retail Credit Card Applications (55% versus 45%)
12. Certificate of Deposit Calculators (44% versus 56%)
Healthcare
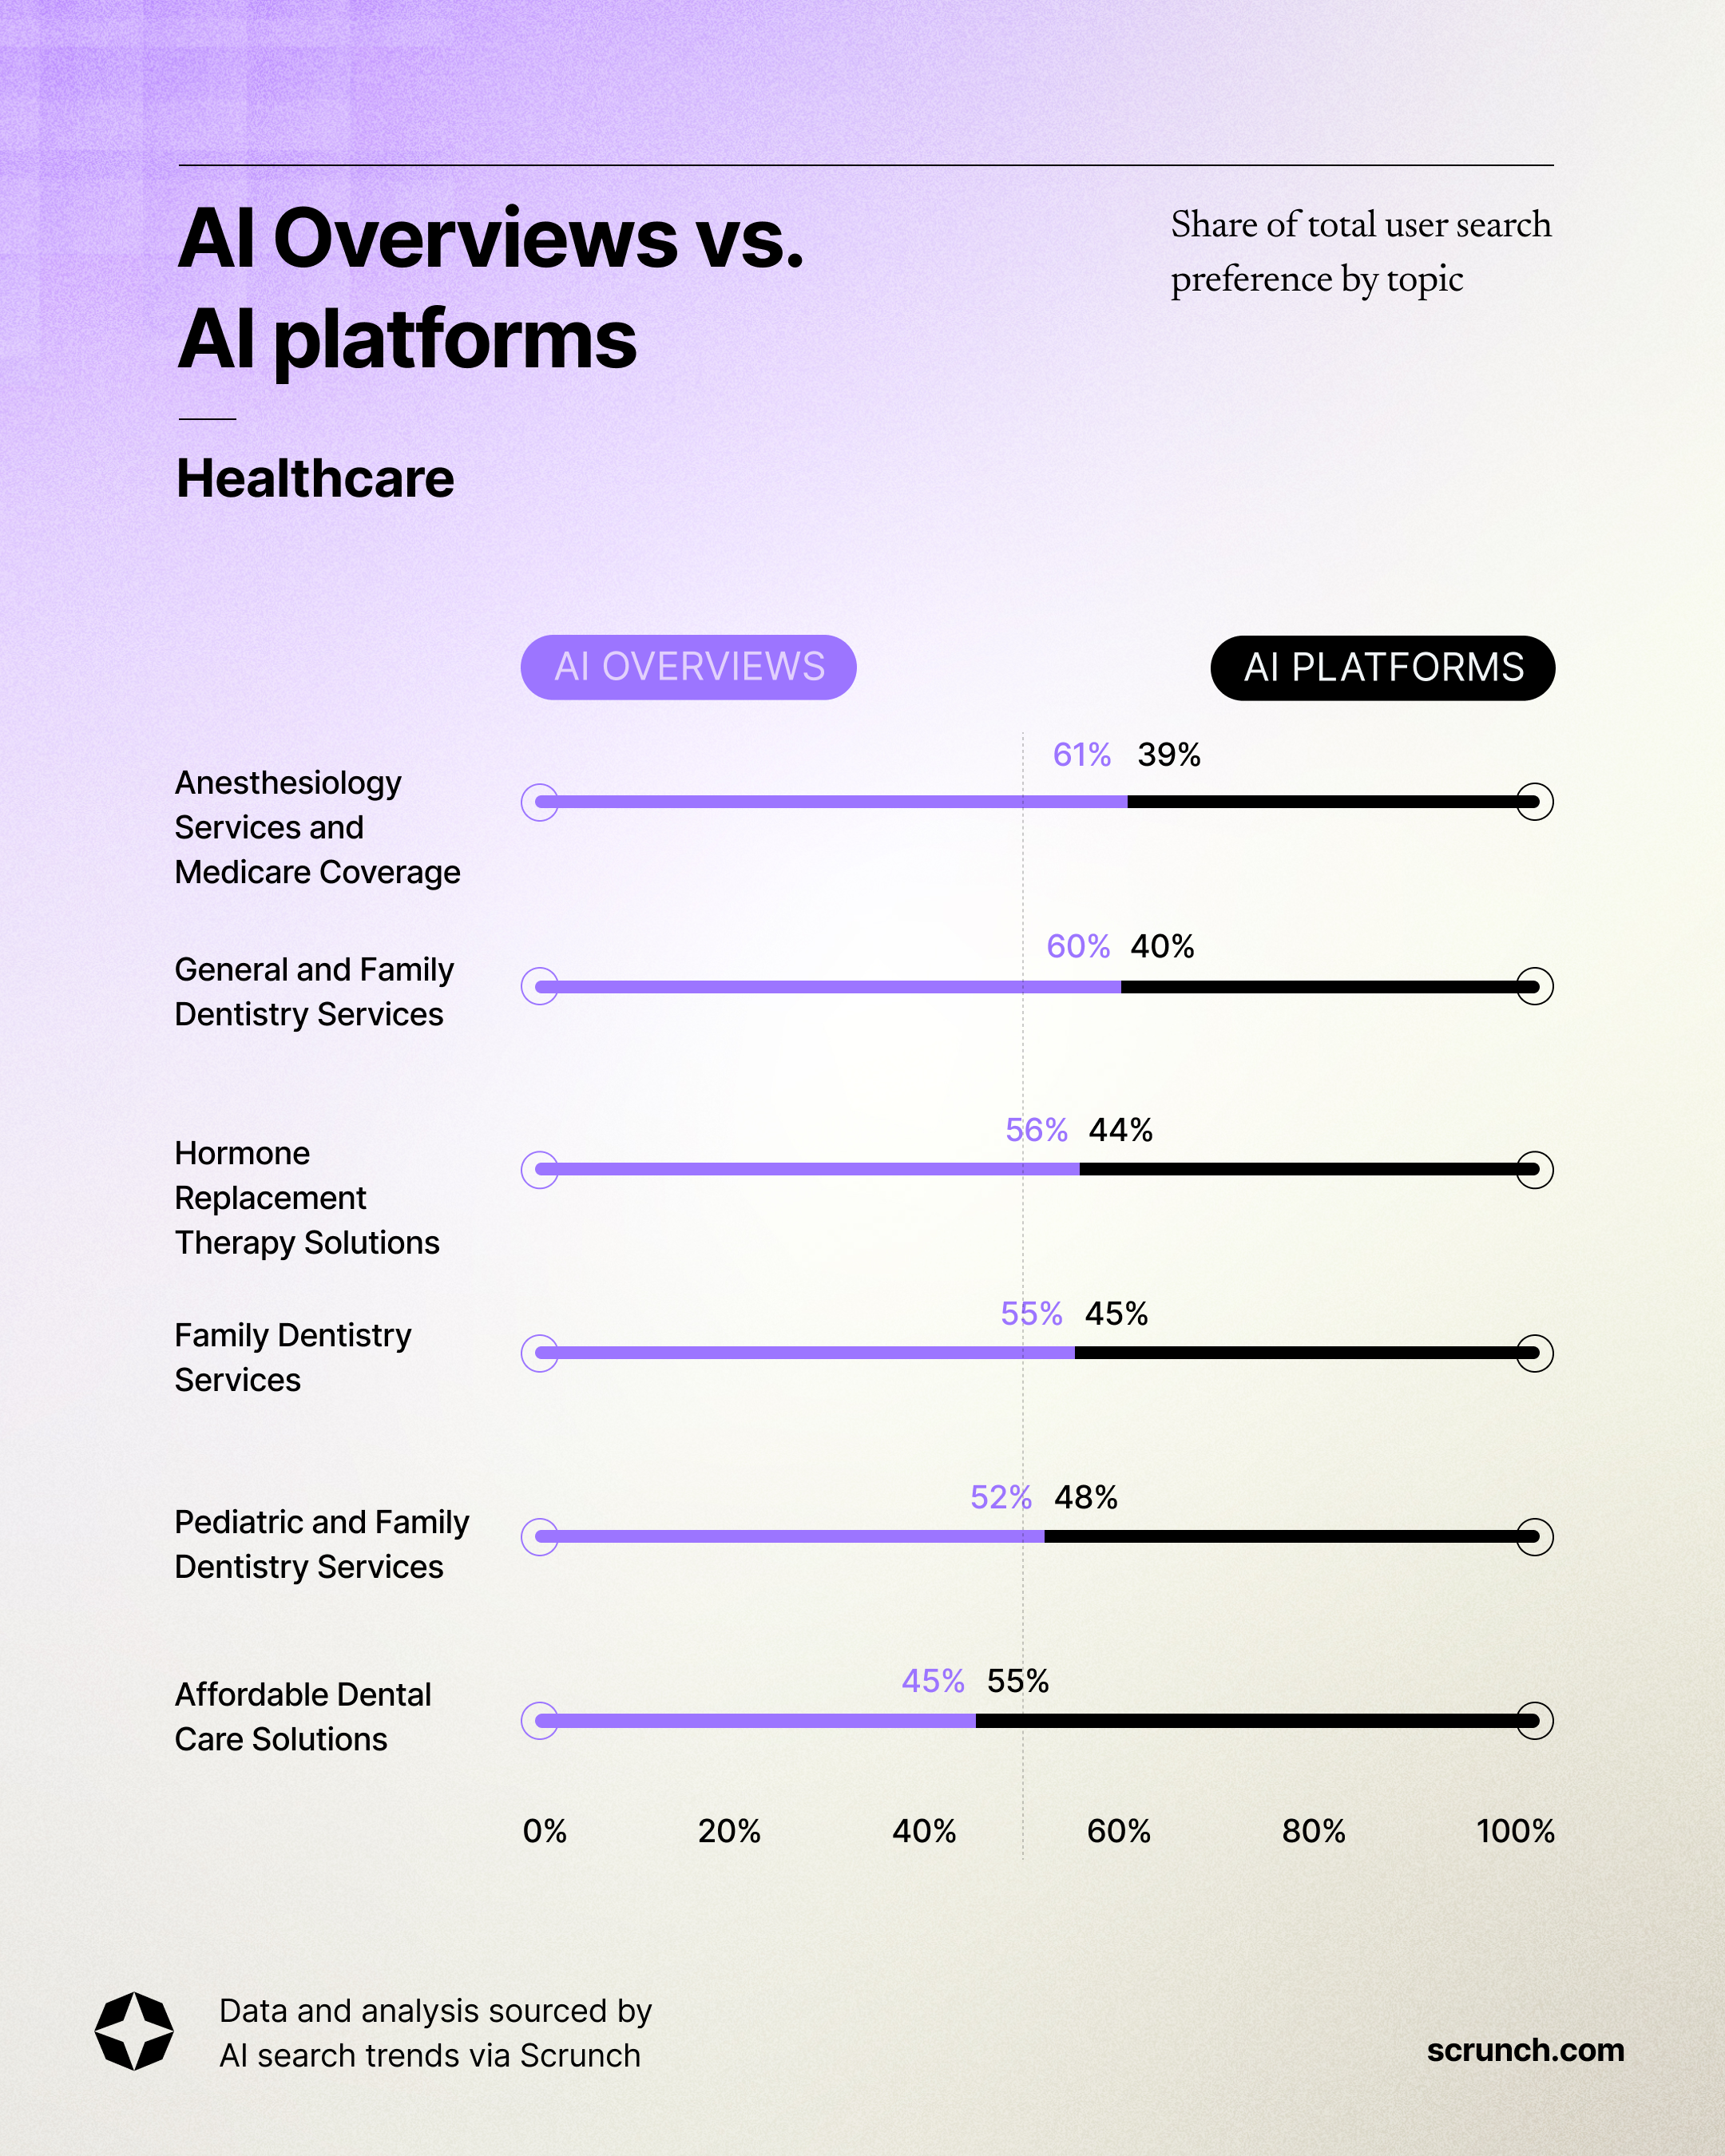
1. Anesthesiology Services and Medicare Coverage (61% versus 39%)
2. General and Family Dentistry Services (60% versus 40%)
3. Prescription Savings Solutions (59% versus 41%)
4. Paid Plasma Donation Services (58% versus 42%)
5. Sleep Apnea Equipment Solutions (58% versus 42%)
6. Hormone Replacement Therapy Solutions (56% versus 44%)
7. Family Dentistry Services (55% versus 45%)
8. Herbal Health Benefits (54% versus 46%)
9. Medical Marijuana Dispensaries (54% versus 46%)
10. Rehabilitation Services (53% versus 47%)
11. Pediatric and Family Dentistry Services (52% versus 48%)
12. Affordable Dental Care Solutions (45% versus 55%)
Ecommerce
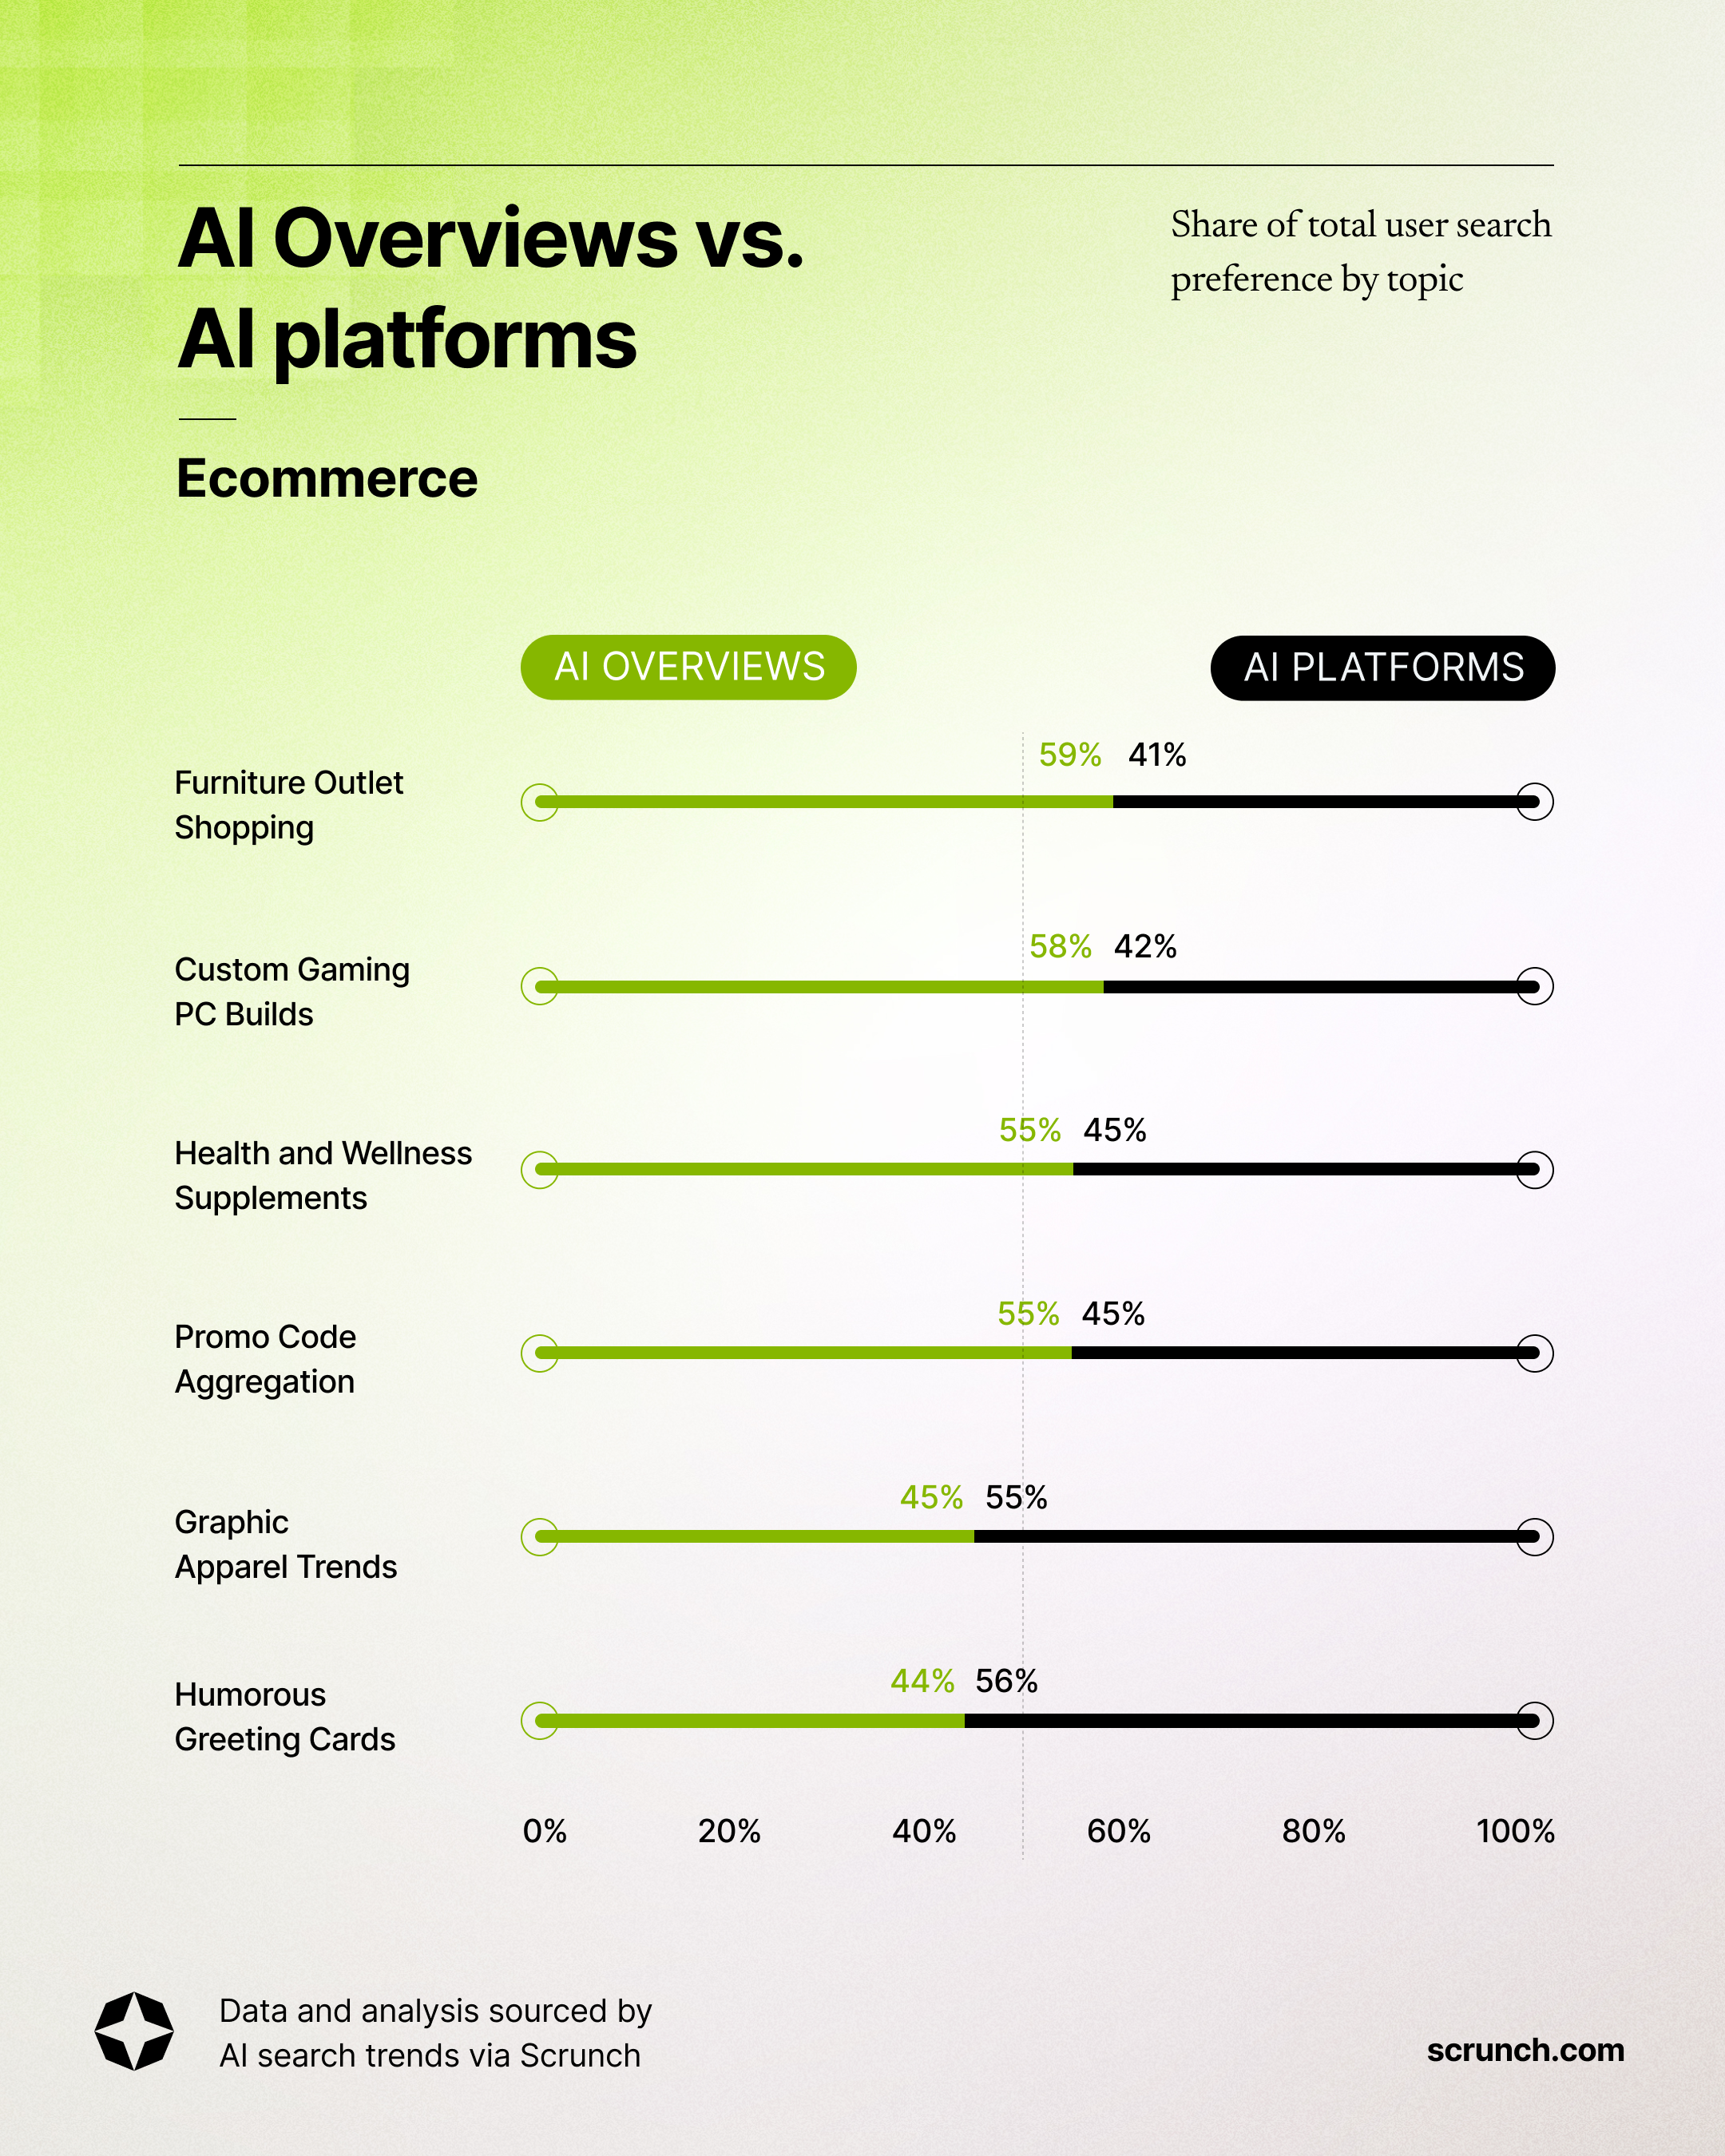
1. Furniture Outlet Shopping (59% versus 41%)
2. Custom Gaming PC Builds (58% versus 42%)
3. Colon and Intestinal Detoxification (57% versus 43%)
4. Tire Retail and Repair Services (56% versus 44%)
5. Fashion Discount Codes (56% versus 44%)
6. Health and Wellness Supplements (55% versus 45%)
7. Promo Code Aggregation (55% versus 45%)
8. Coin Collecting Valuation (54% versus 46%)
9. Men's and Women's Themed Socks (54% versus 46%)
10. Meal Replacement Nutrition Products (54% versus 46%)
11. Graphic Apparel Trends (45% versus 55%)
12. Humorous Greeting Cards (44% versus 56%)
Automotive
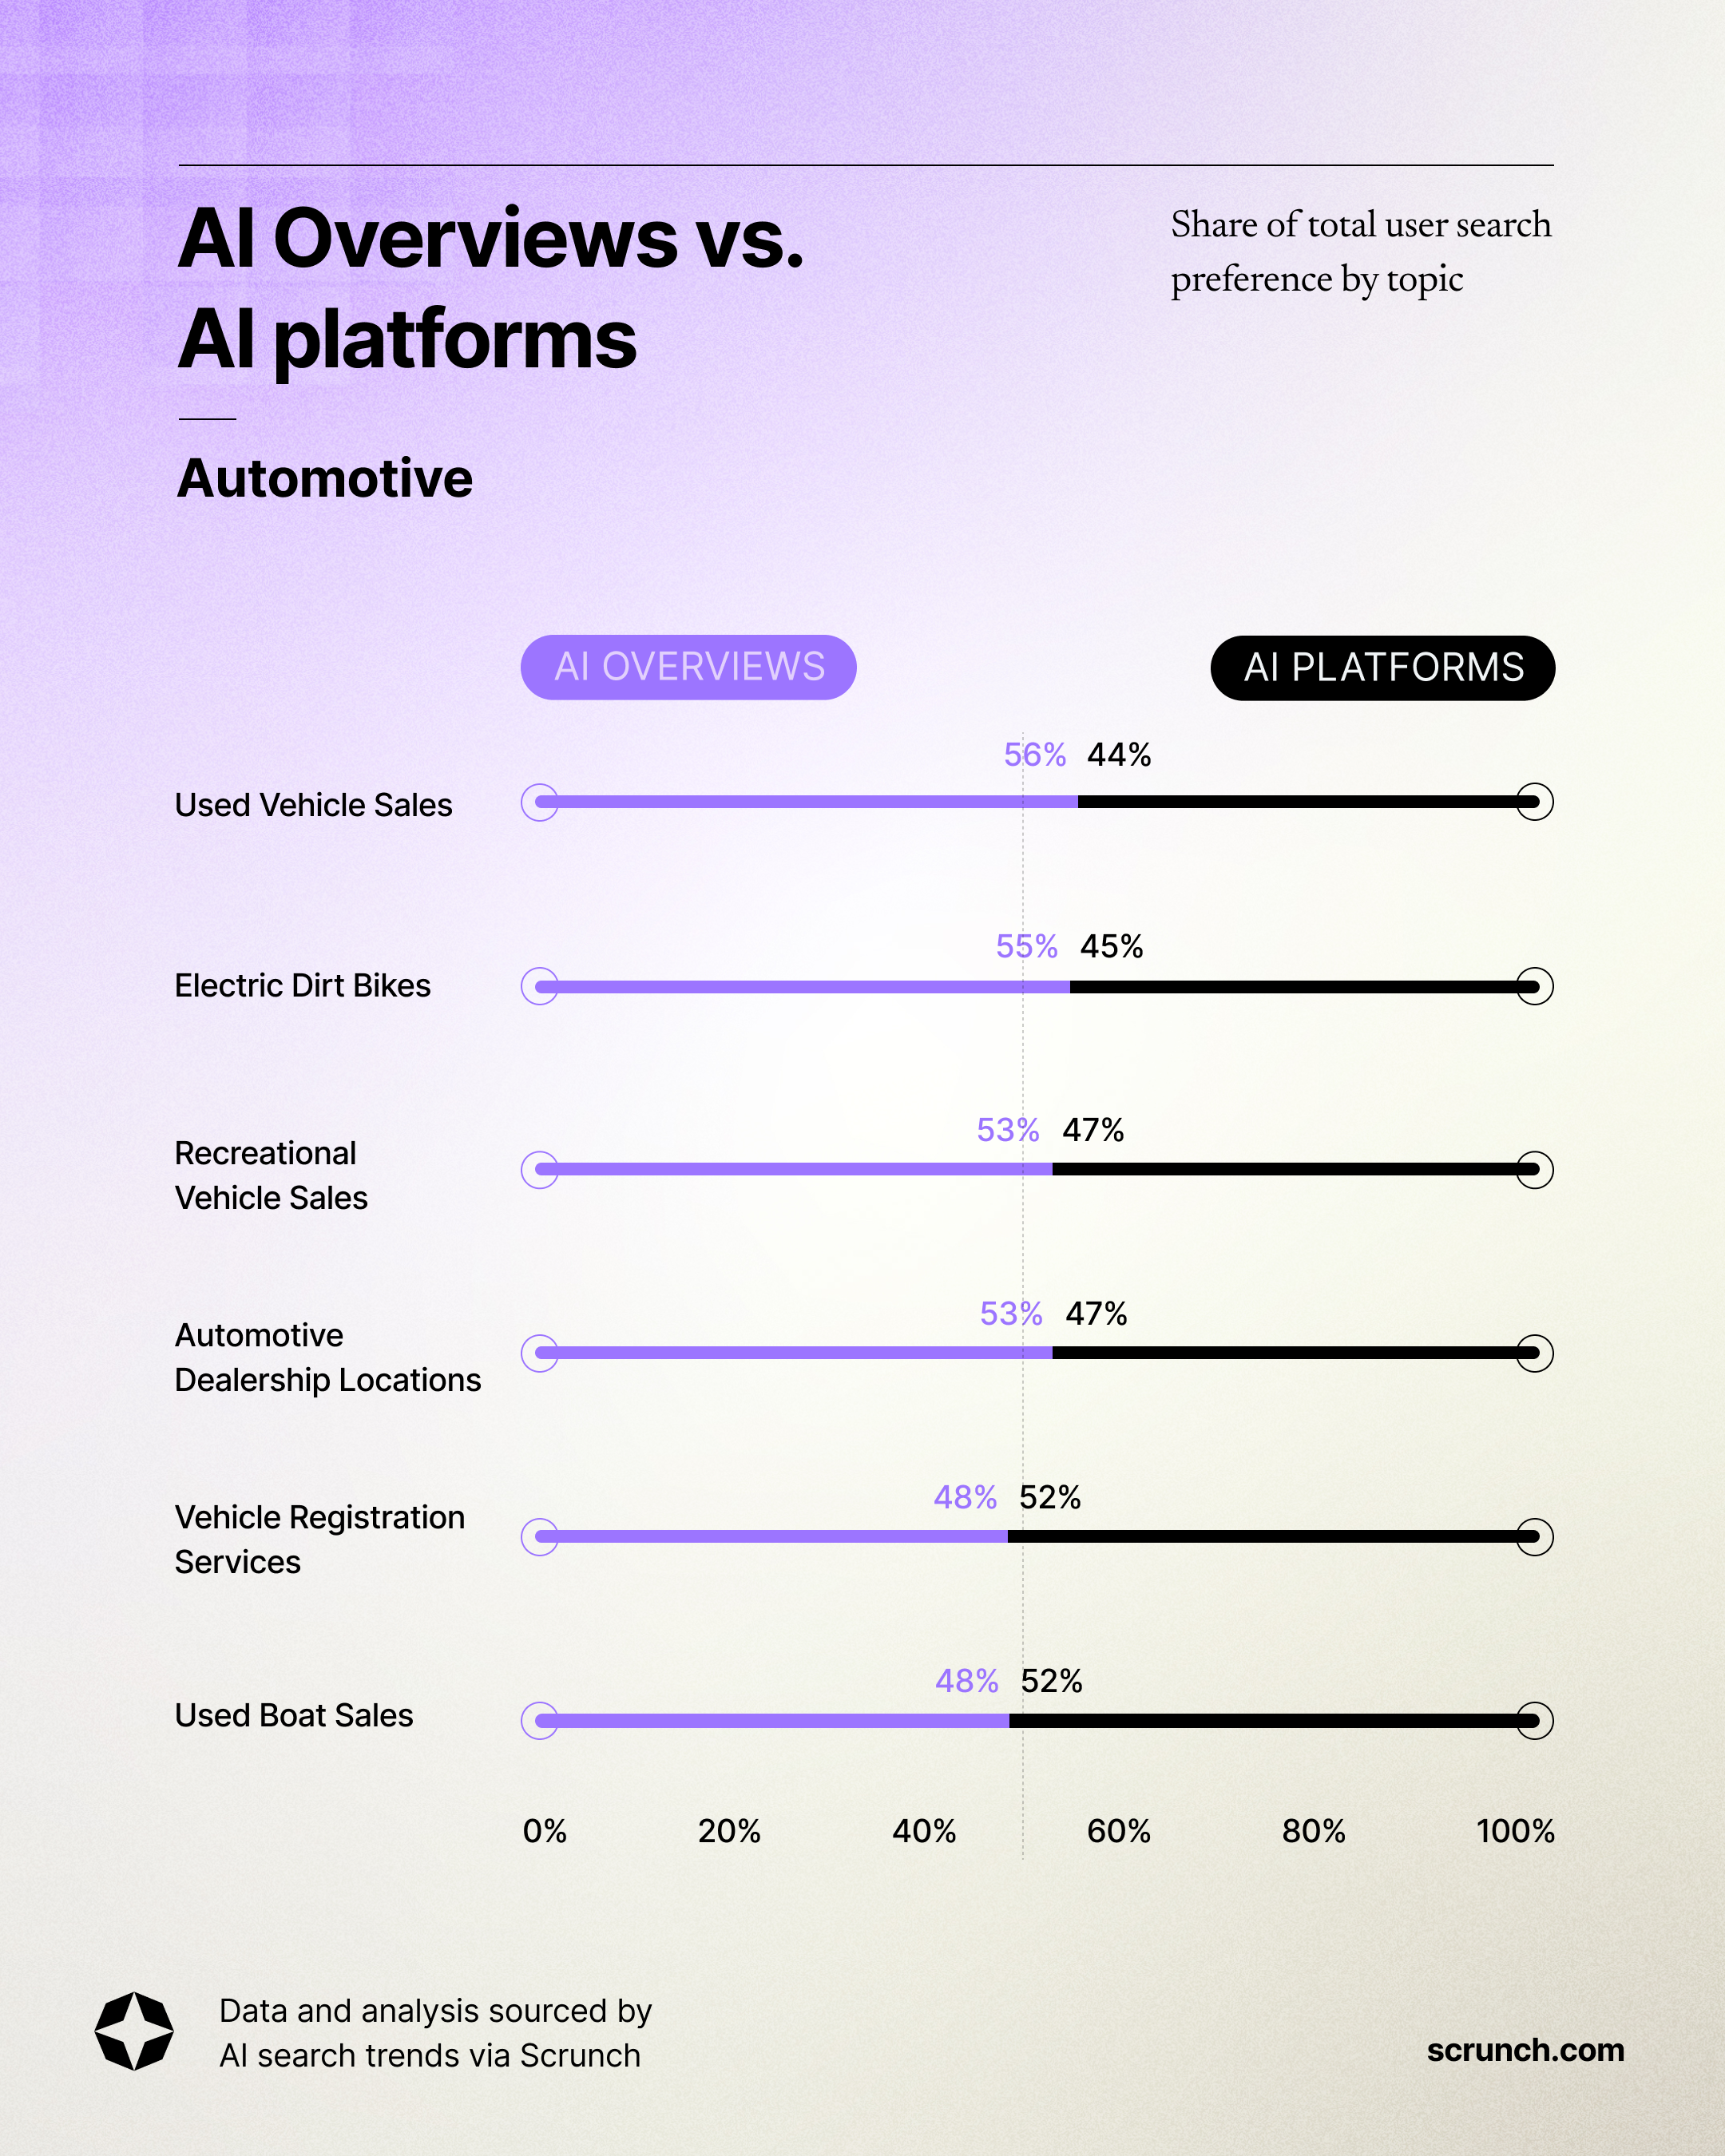
1. Used Vehicle Sales (56% versus 44%)
2. Electric Dirt Bikes (55% versus 45%)
3. Auto Salvage and Scrap Services (54% versus 46%)
4. Cash for Junk Cars (53% versus 47%)
5. Automotive Key Replacement Services (53% versus 47%)
6. Recreational Vehicle Sales (53% versus 47%)
7. Automotive Dealership Locations (53% versus 47%)
8. Vehicle Registration and Title Services (52% versus 48%)
9. Cross Country Vehicle Transport (51% versus 49%)
10. Automotive Dealership Services (49% versus 51%)
11. Vehicle Registration Services (48% versus 52%)
12. Used Boat Sales (48% versus 52%)
Education
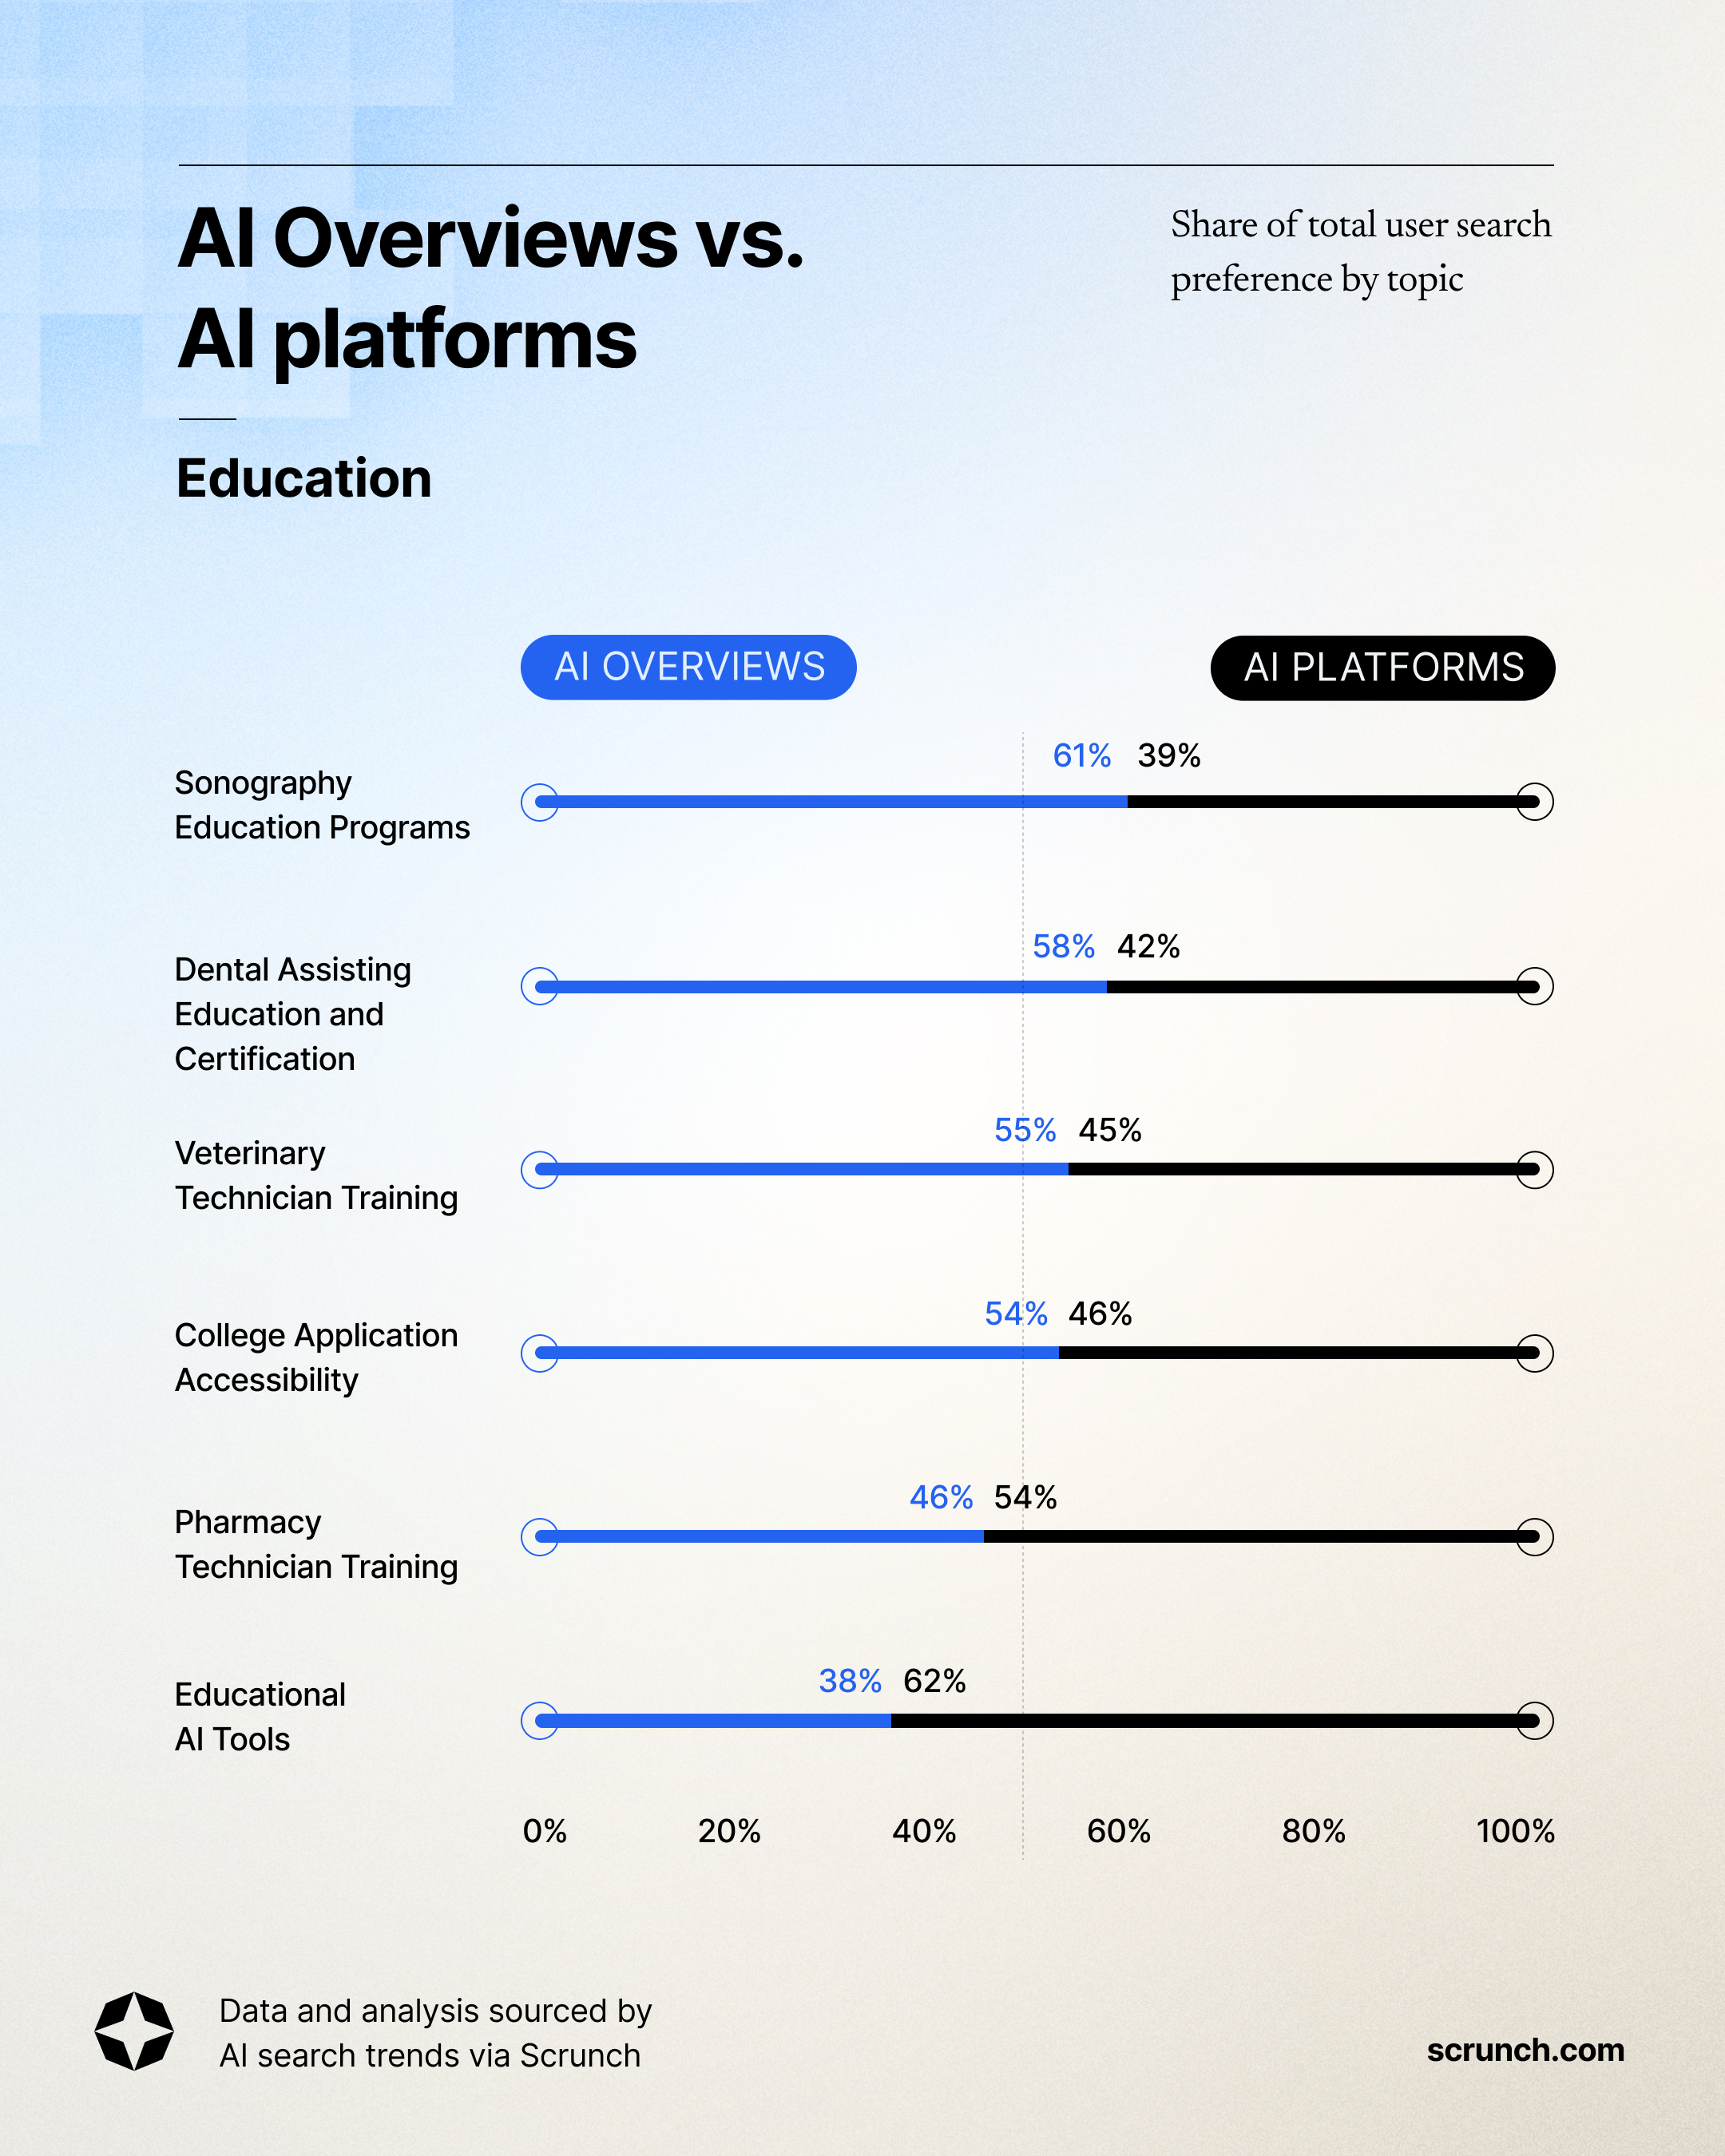
1. Sonography Education Programs (61% versus 39%)
2. Dental Assisting Education and Certification (58% versus 42%)
3. Free Programming Education (58% versus 42%)
4. Human Resource Education Programs (57% versus 43%)
5. Radiology Tech Education (56% versus 44%)
6. Veterinary Technician Training (55% versus 45%)
7. College Application Accessibility (54% versus 46%)
8. Canadian Higher Education Institutions (54% versus 46%)
9. Education and Career Development (51% versus 49%)
10. Graphic Design Education (50% versus 50%)
11. Pharmacy Technician Training (46% versus 54%)
12. Educational AI Tools (38% versus 62%)
Software
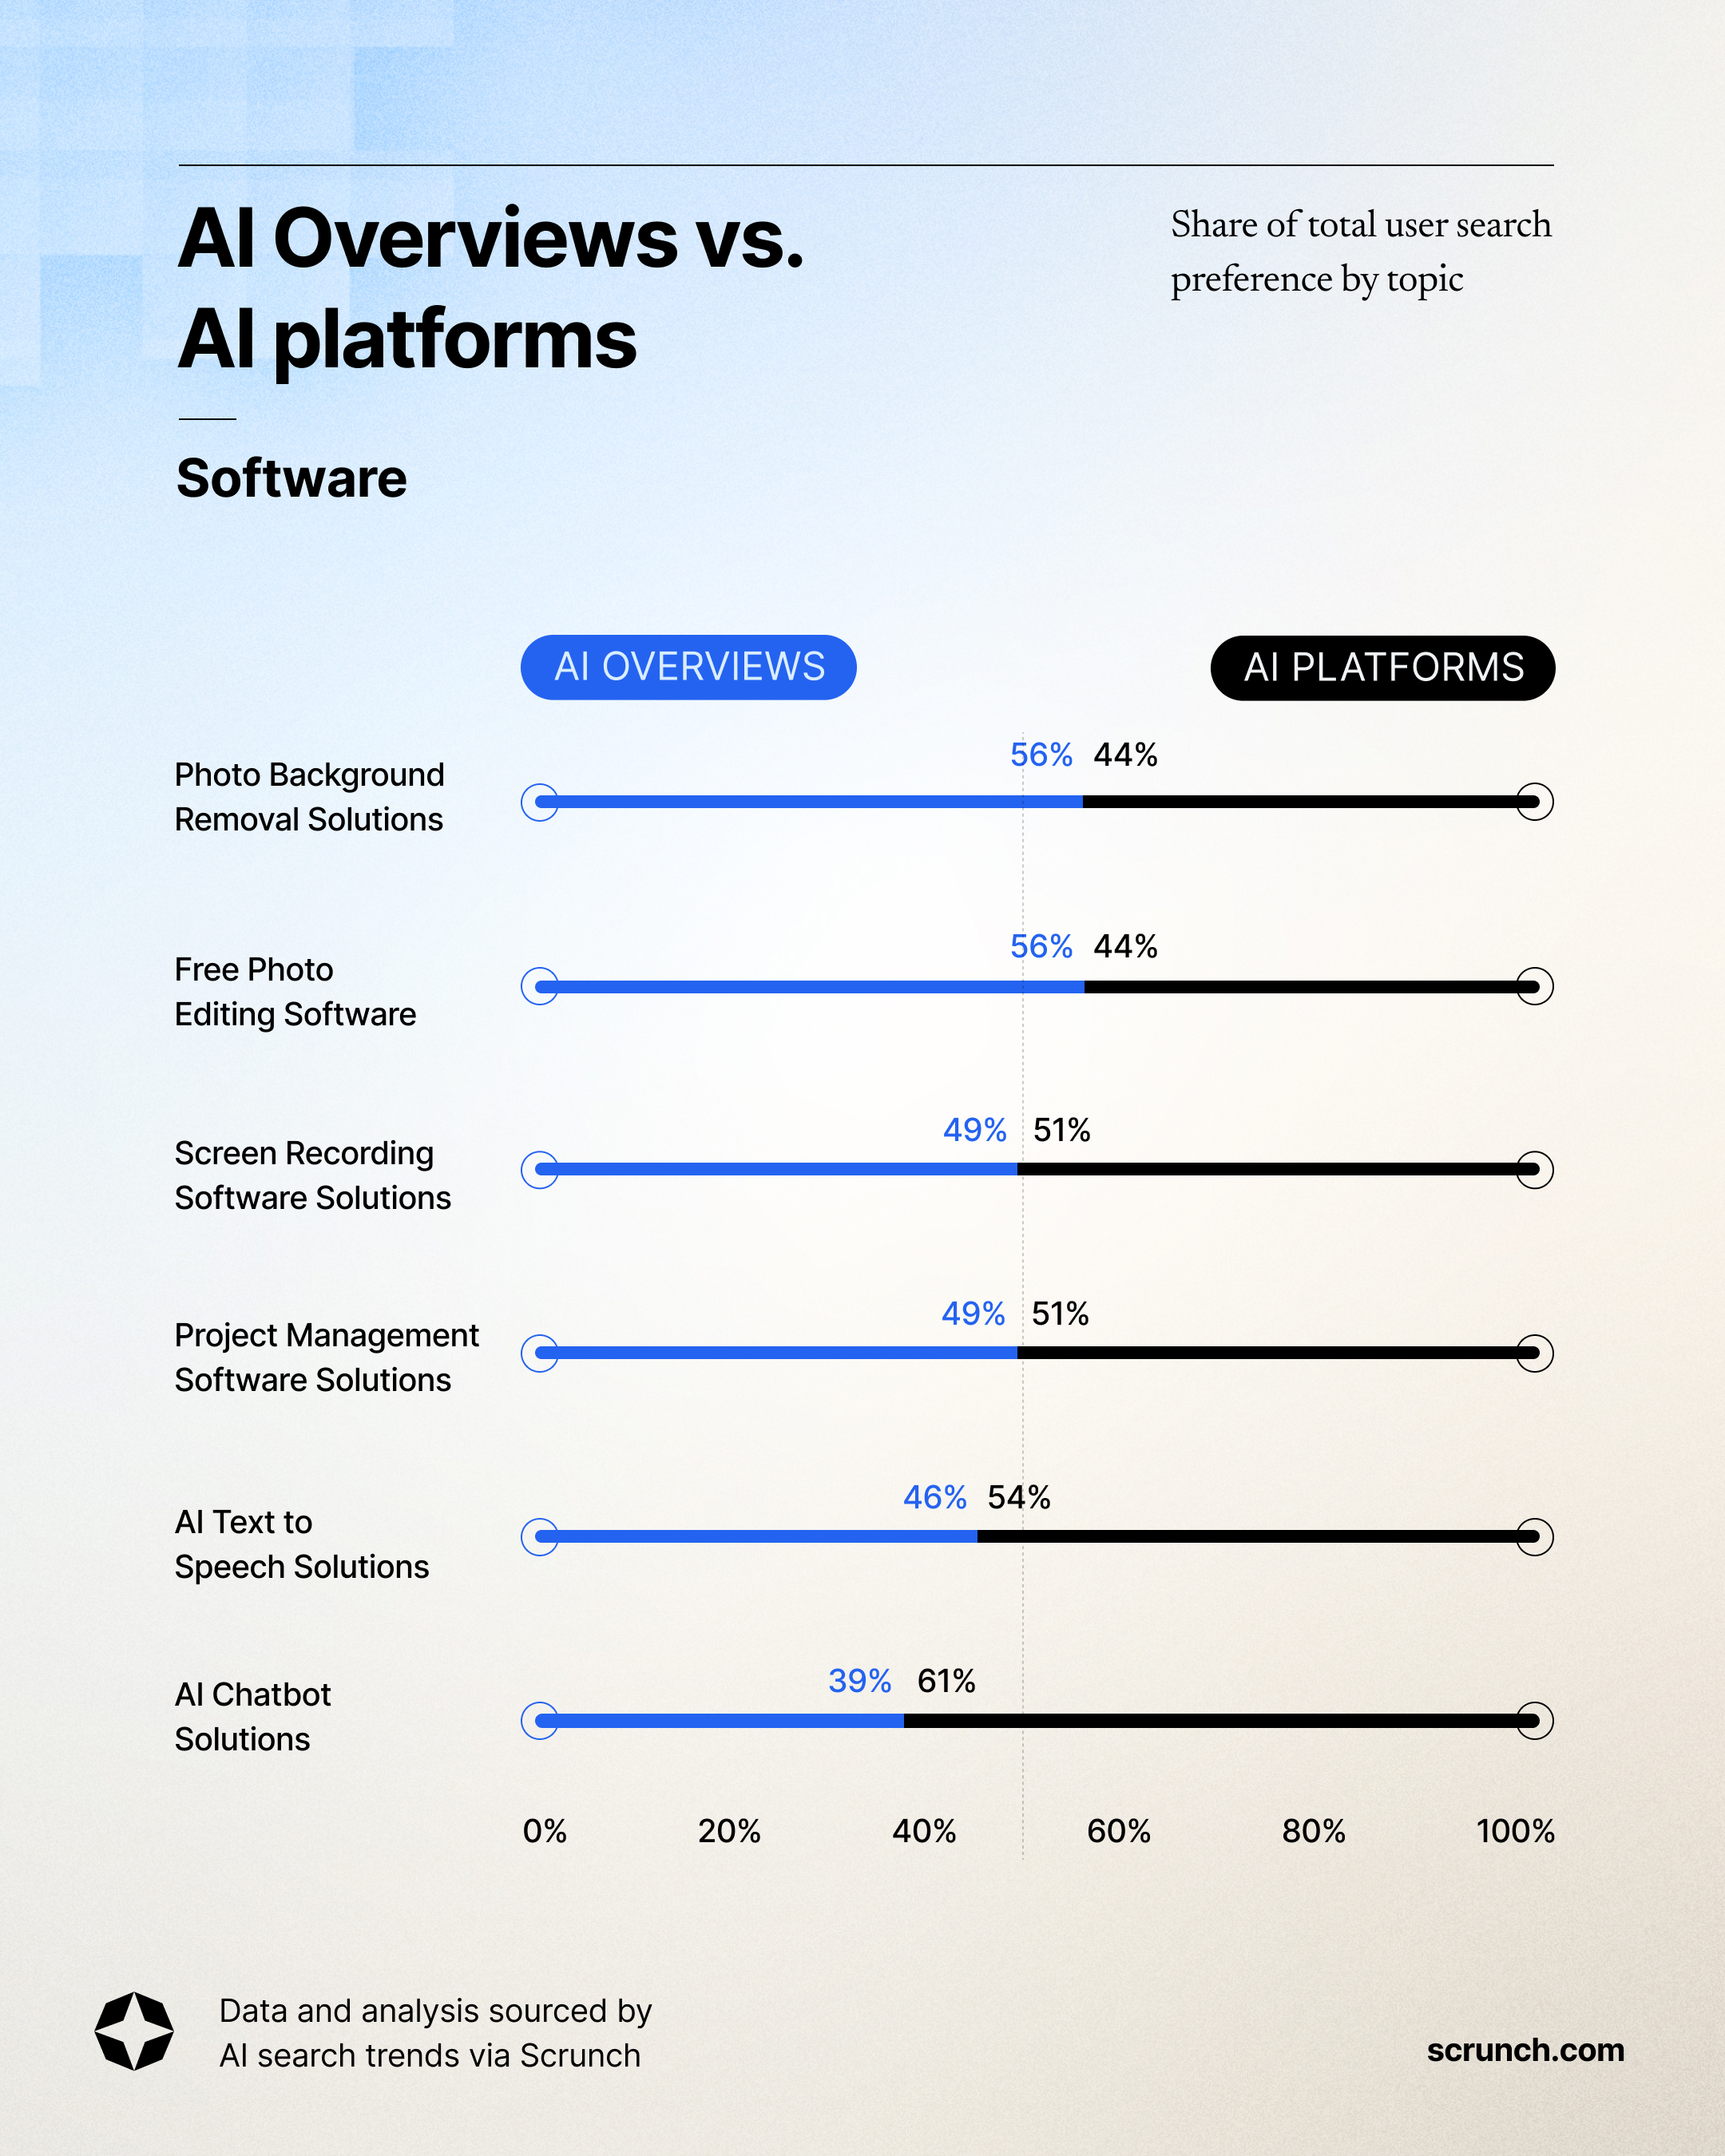
1. Photo Background Removal Solutions (56% versus 44%)
2. Free Photo Editing Software (56% versus 44%)
3. Time Tracking Software Solutions (55% versus 45%)
4. WordPress Ecommerce Solutions (54% versus 46%)
5. Dynamic QR Code Solutions (49% versus 51%)
6. Screen Recording Software Solutions (49% versus 51%)
7. Project Management Software Solutions (49% versus 51%)
8. AI Writing Assistance Solutions (49% versus 51%)
9. AI Music Generation Tools (48% versus 52%)
10. AI Avatar Creation Tools (46% versus 54%)
11. AI Text to Speech Solutions (46% versus 54%)
12. AI Chatbot Solutions (39% versus 61%)
Visible everywhere or invisible somewhere
The AI search market is fragmented. You can’t assume that one channel will dominate the discovery path.
Whether the intent behind the search is “tell me more” or “show me my options,” it pays to optimize for both generative overlays and conversational agents.
Three pieces of advice:
1. Start with cross-channel visibility across every major LLM
You can’t identify areas of opportunity if you don’t know how your brand (or your competitor’s brand) is showing up in these channels.
2. Make sure AI can crawl and interpret your website
If LLMs can’t access critical pages on your site, optimization efforts are moot. You’ll stay invisible no matter which mode of AI search users prefer.
3. Don’t assume SEO has gone the way of the dinosaur in the AI age
AI retrieval agents are influenced by the same core ranking factors as search engine results pages, and Google AI Overviews in particular are generated from a subset of results that already rank well in Google’s traditional search index.
Just remember: If you’re only visible in one channel, you’re losing market share in others.
Get started with Scrunch
Start a 7-day free trial or get in touch to monitor and optimize performance across every LLM.


